
The atmospheric pressure logger with the sea level correction automatically by using GPS height information. If you want to run background, keep logging every several hours(this mode consumes more battery). In order to obtain the sea level correction value, we use the GPS position and the temperature of weather information. It is also possible to set height and position information manually if you want to record at a pre-fixed location.
Privacy policy is here.
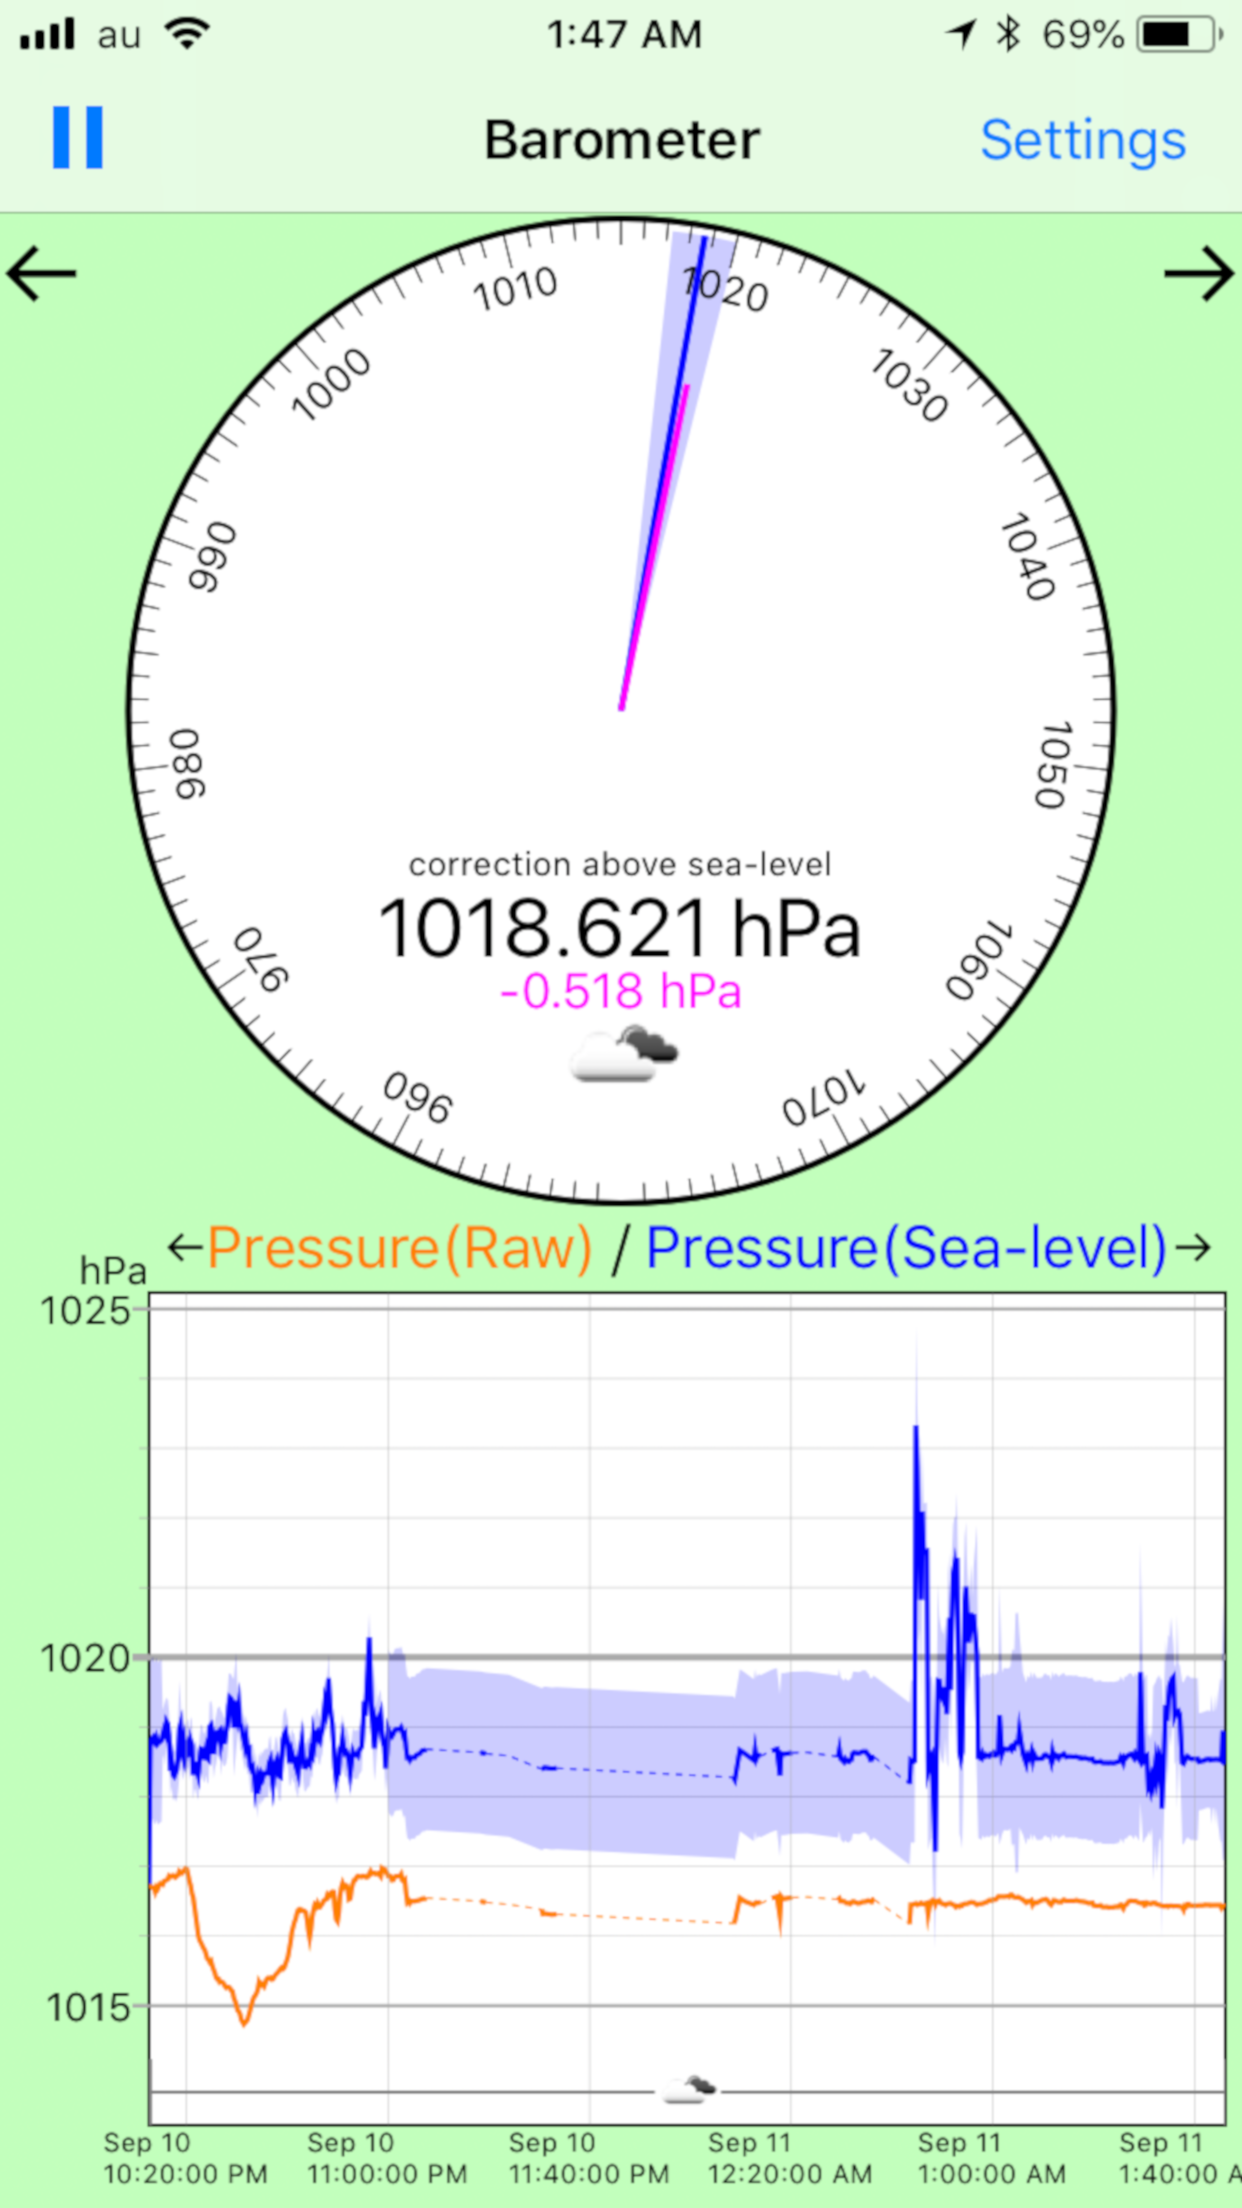
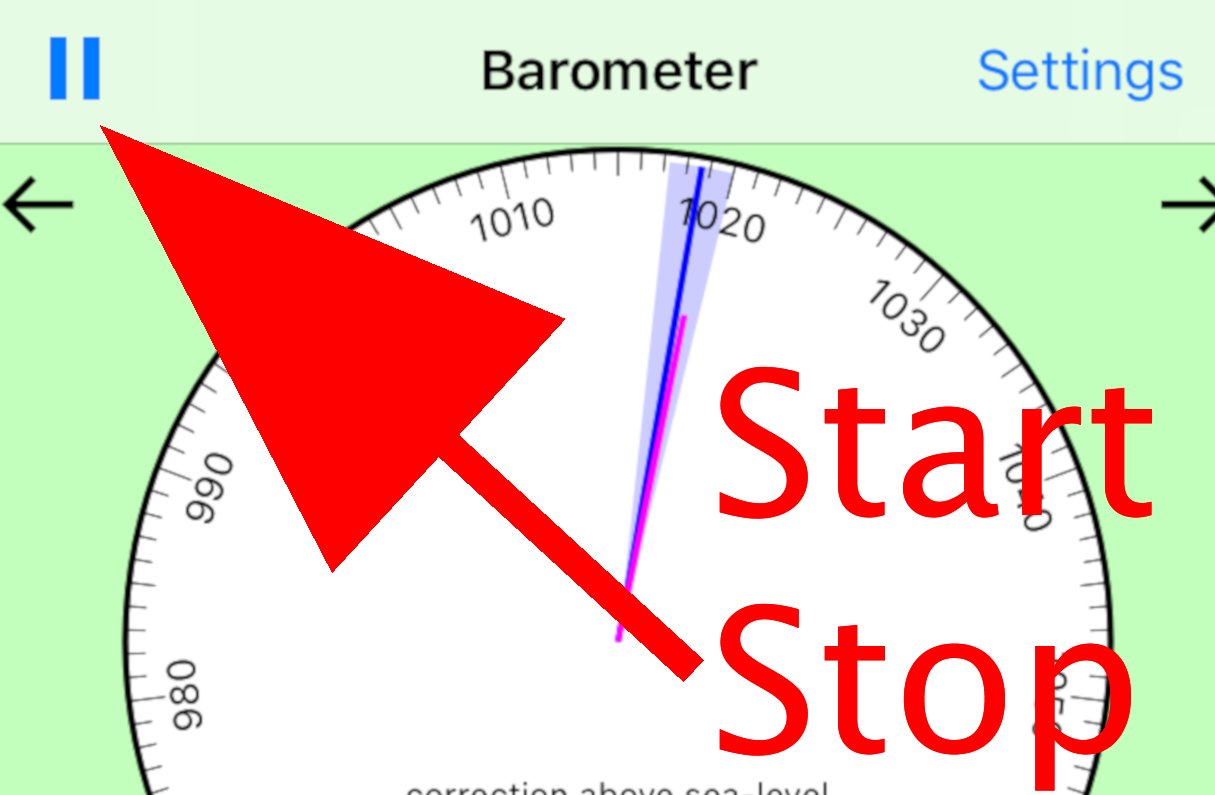
This application is automatically run and keep running in background in default. If you want to stop running in background, tap the stop button on the left top.
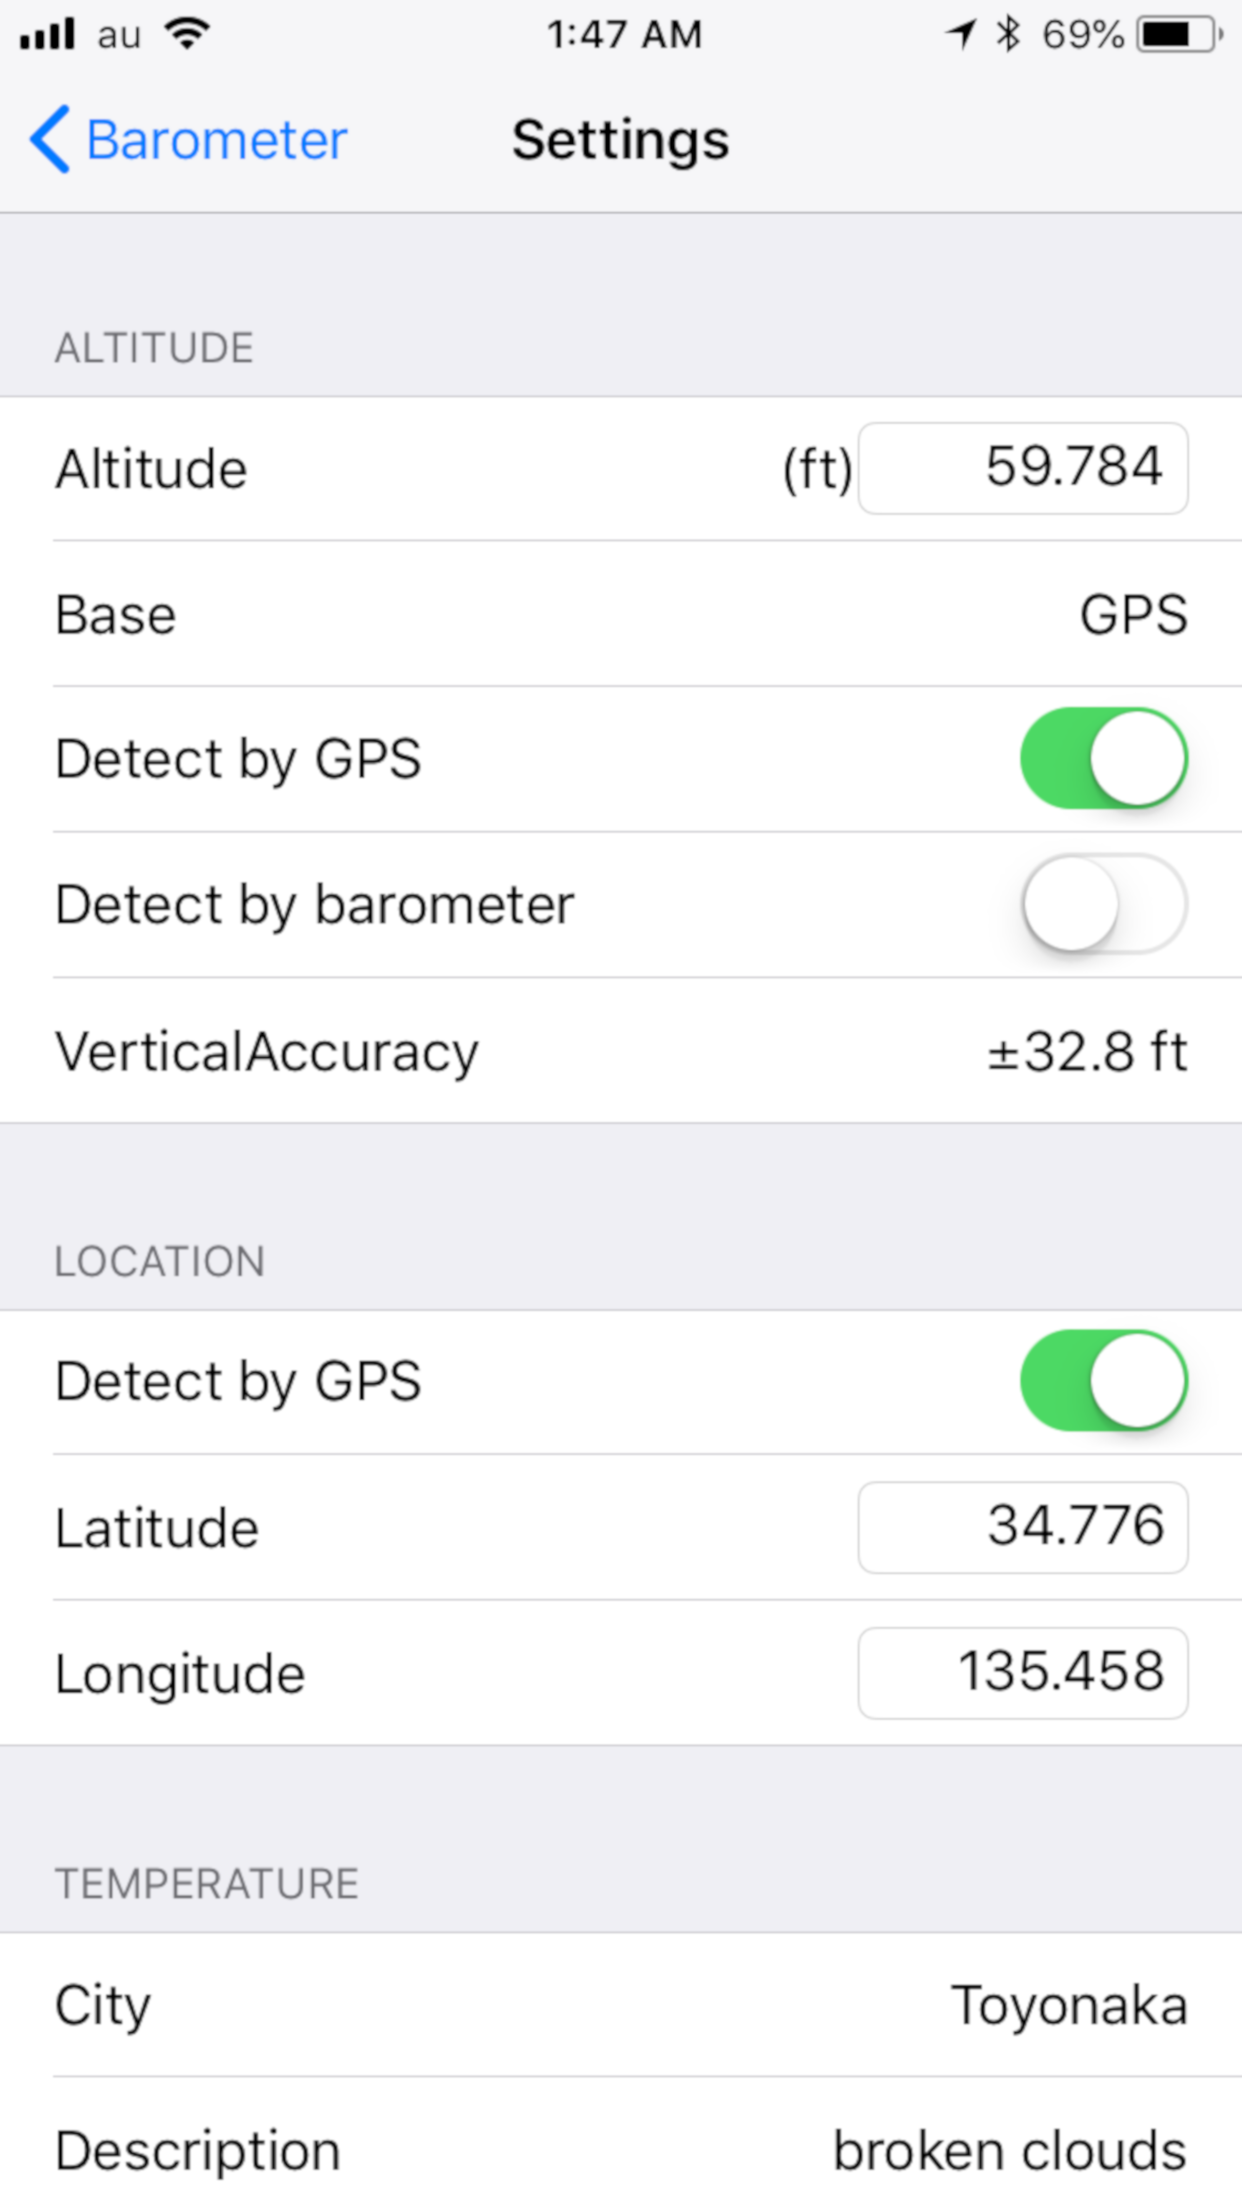
If you need to fix location or altitude or temperature, go to Settings and turn off the "Detect by GPS" or "Detect by Web", input the fixed value.
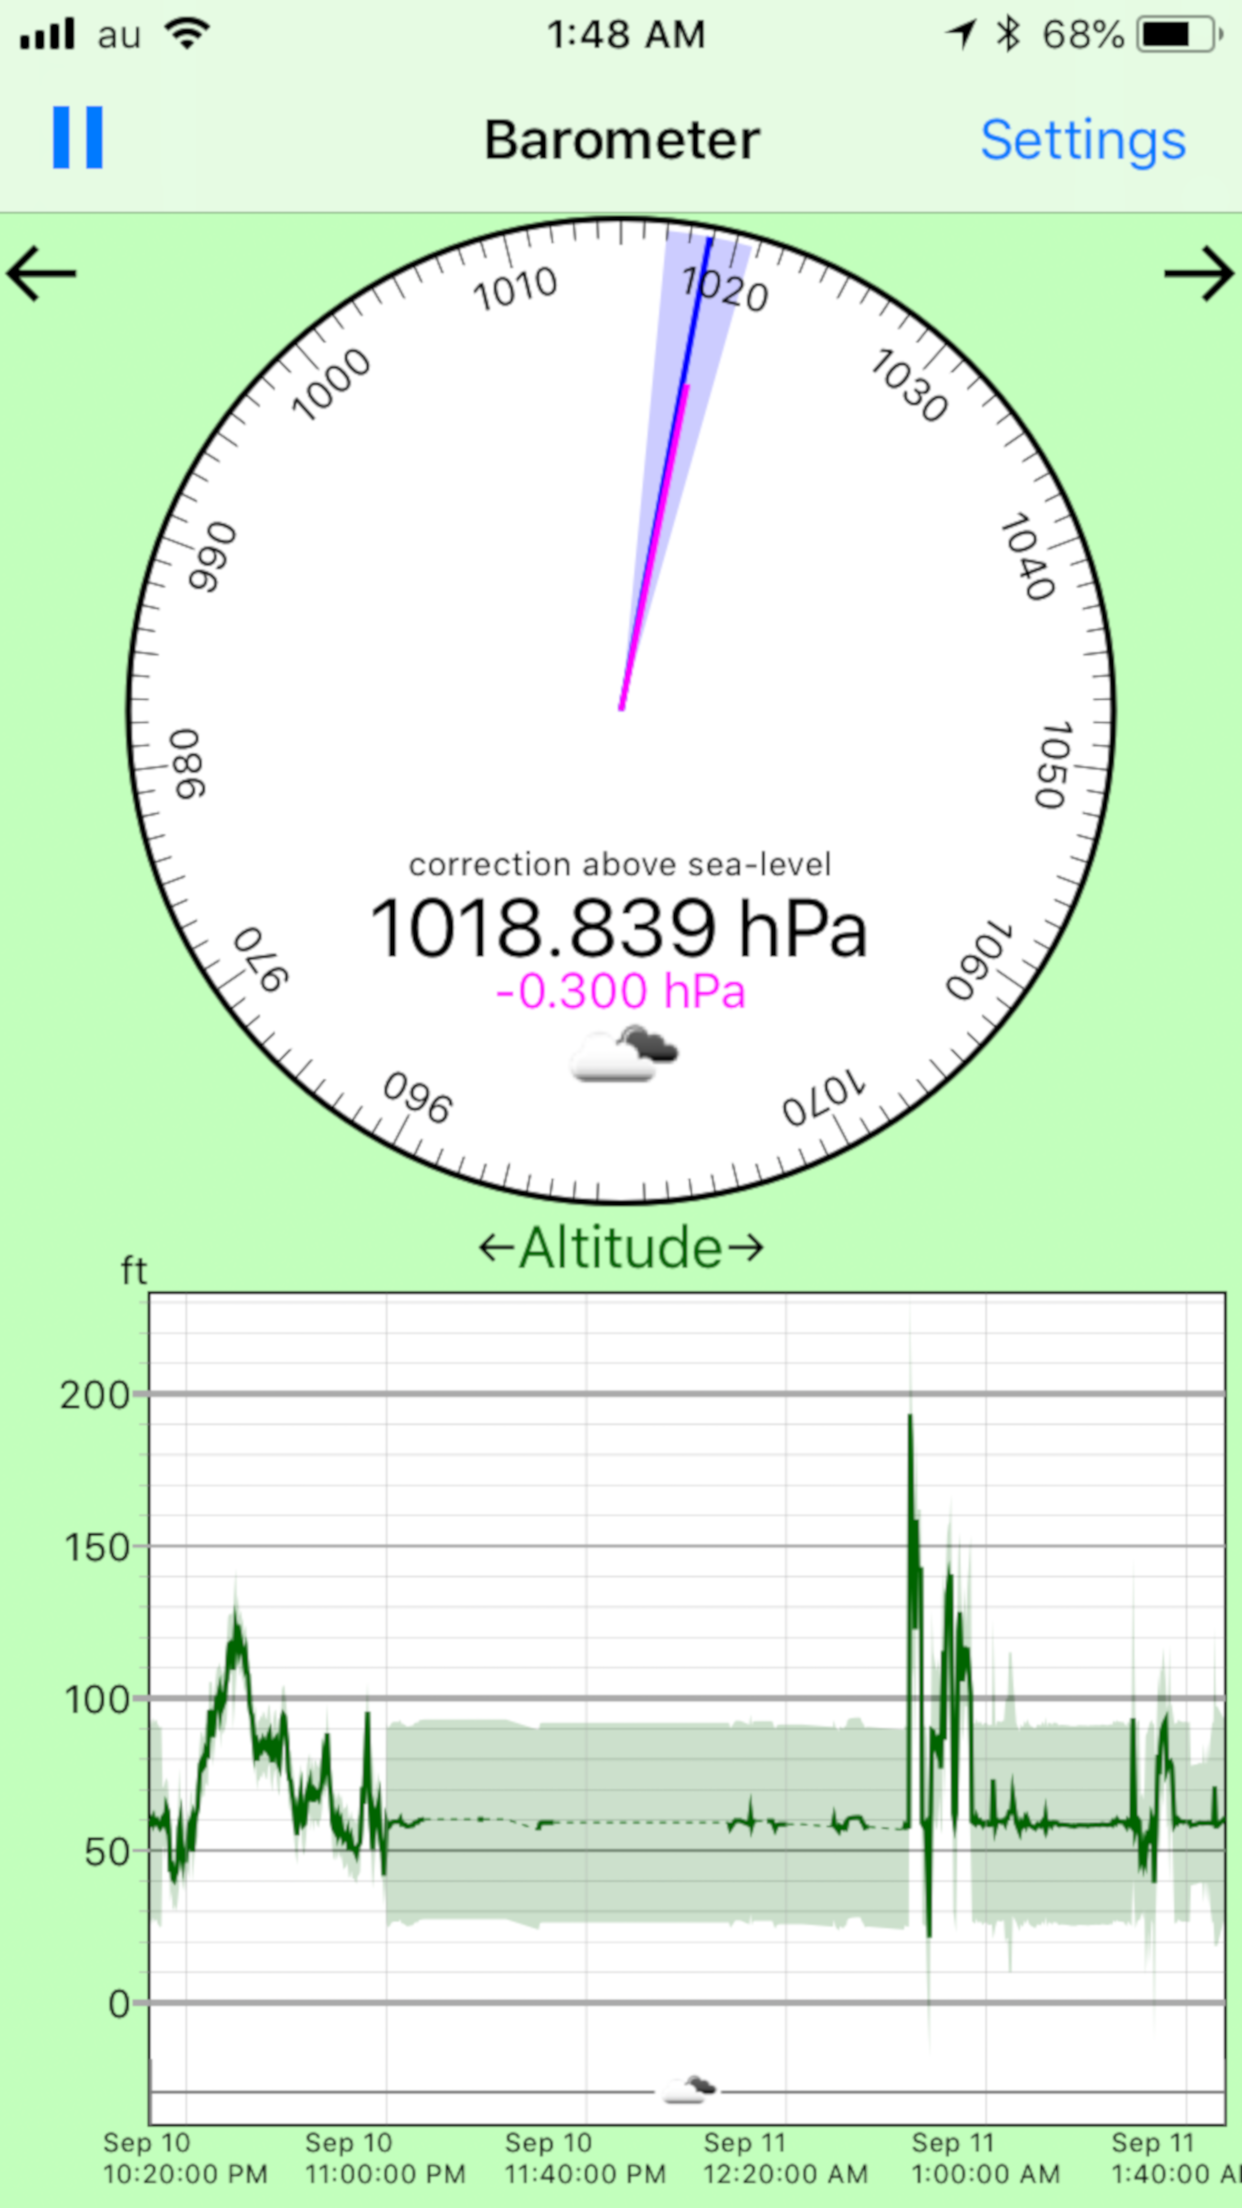
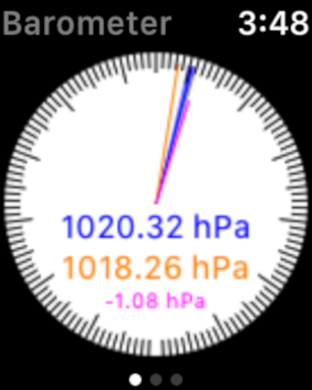
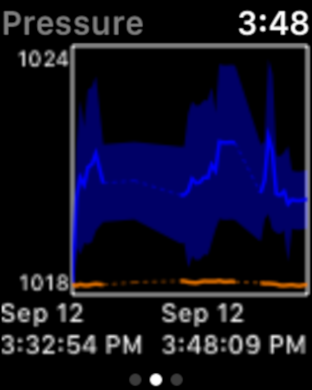
The meter(upper) and plot graph(bottom) are able to change in swipe action. The meter has a pressure value of sea-level correction and a raw pressure value. The plot graph has a dual plot of pressure, sea-level pressure value, raw pressure value, temperature and altitude.
The meter can set a reference value. Set a pressure value at some time, you can know the difference from it. Easily know pressure value is ascending or decending, the weather is getting worse or better. To set a reference, long tap in the meter area and select a menu "Set reference".
The plot is scaled to a day in default. You can zoom in or zoom out by a pinch action. A two finger drag(pan) action scrolls the plot horizontally.
The plot log can export and import in long tap menu on the plot area. The "Export log" store the log data to some place(in iPhone or cloud storage) in csv format. The "Import log" load a saved log data in any place(in iPhone or cloud storage). Keep mind the "Import log" wipe out the current log data before loading. If you need current log data, export data in first. The log data can clear in the long tap menu.
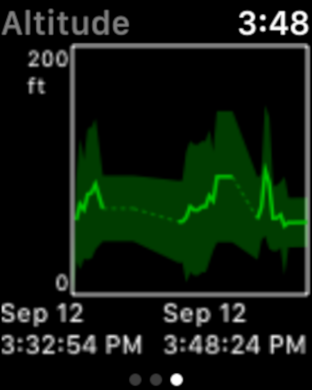
In the watch app, the meter and two plots, both pressure values plot and altitude plot are available. The meter displays both pressure value, raw value and sea-level value. If you set the reference in iPhone, the reference is also displayed.
In plot page, you can zoom in the plot by tap and zoom out to original by long tap. In Watch, the plot shows all logs in default. To scroll horizontally, rotate the digital crown.
This application is totally free. In app purchase items are just a donation. If you purchase the items, the secret images are shown.
back to indexcontact address contact@lithium03.info